In our series of blog posts, we’ve been talking about how SharePoint and cloud solutions have put sophisticated systems within reach of the small to mid-sized companies.
These solutions not only have the power to untangle the nitty-gritty of day-to-day operations so they flow more smoothly, but also to provide the big picture through an executive dashboard.
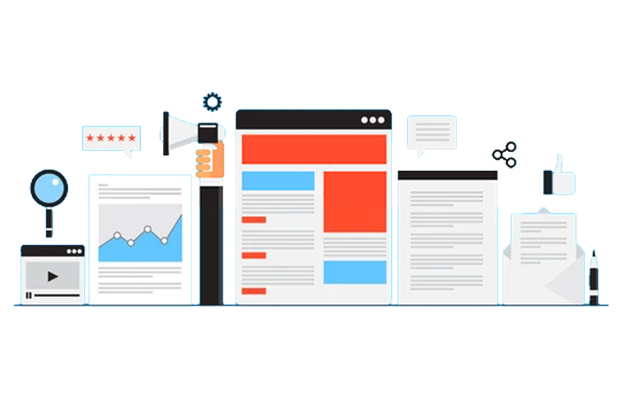
Your executive dashboard, that you can access anywhere, anytime, depicts at a glance your company’s key-performance metrics.

What You Might Discover on Your Dashboard
Your dashboard allows you, for example, to dig beneath your 20% sales growth for the year and find out what’s driving sales up. With a couple taps on your keyboard you can mine the data to discover what’s beneath the trend—whether it’s new customers, a growth segment, a new product or, perhaps, a sales representative who has found the magic formula.
Here are a few more examples of key performance indicators you might see in your dashboard.
- Your website processed 47 inquiries yesterday.
- Your company has 10 proposals due.
- Proposals already sent to clients represent 3500 hours of work.
- Your close ratio on proposals is 55%.
- Two out of three prospects are located in the U.S. and the rest are global.
- The campaign source for each of the inquiries.
- How many orders and how much revenue is generated from each campaign.
You can see how this data enables you to view your pipeline of business, predict future sales, duplicate your successes and grow your business. But that’s not all. Additional data can help you assure maximum productivity; stable cash flow; the status on hiring the new accountant; bottlenecks in new product development and more.
Interested? To learn more about how to create processes and systems that enable you to scale your business, subscribe to this blog.
Call us at 484-892-5713 or Contact Us today if you’d like to discover more about how a SharePoint implementation can help you.